Forecast
BARENTS-2.5
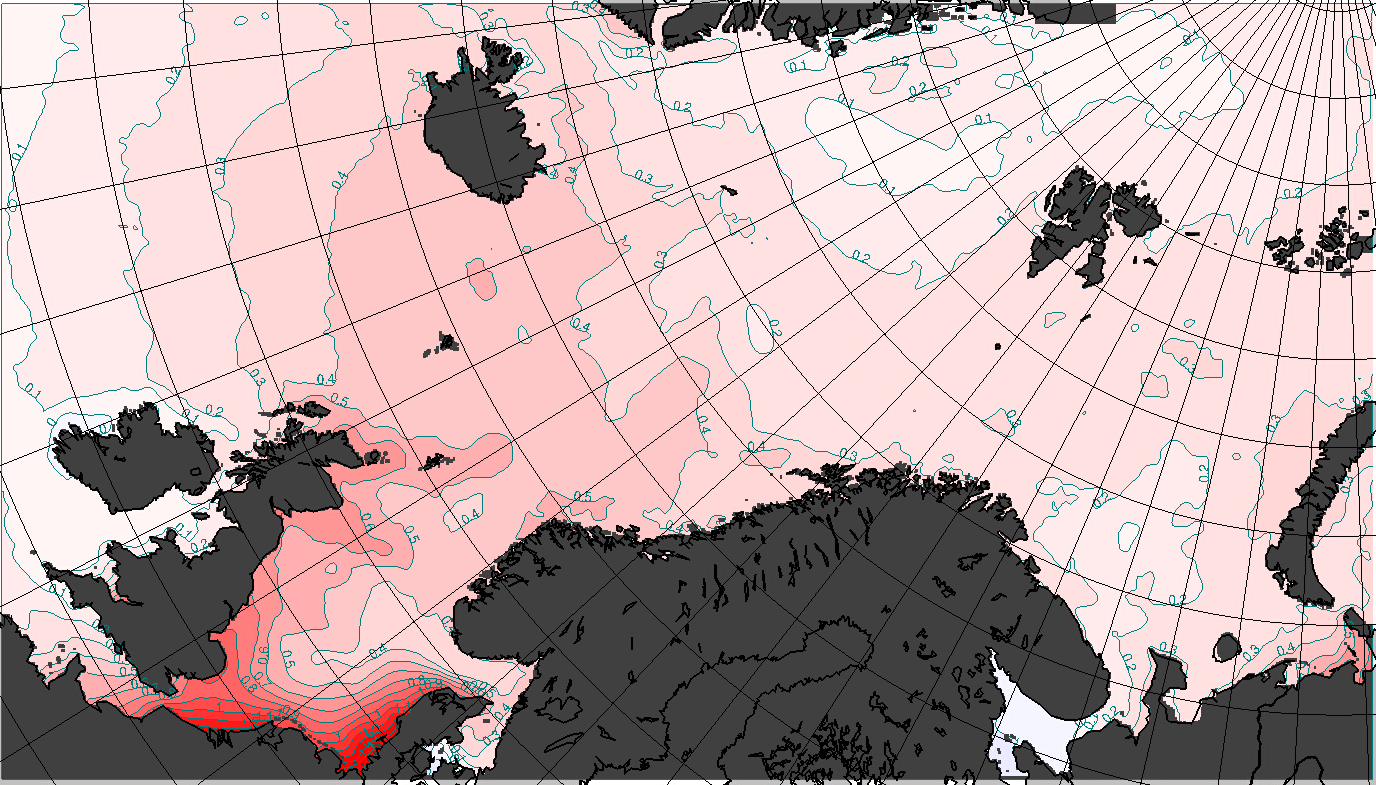
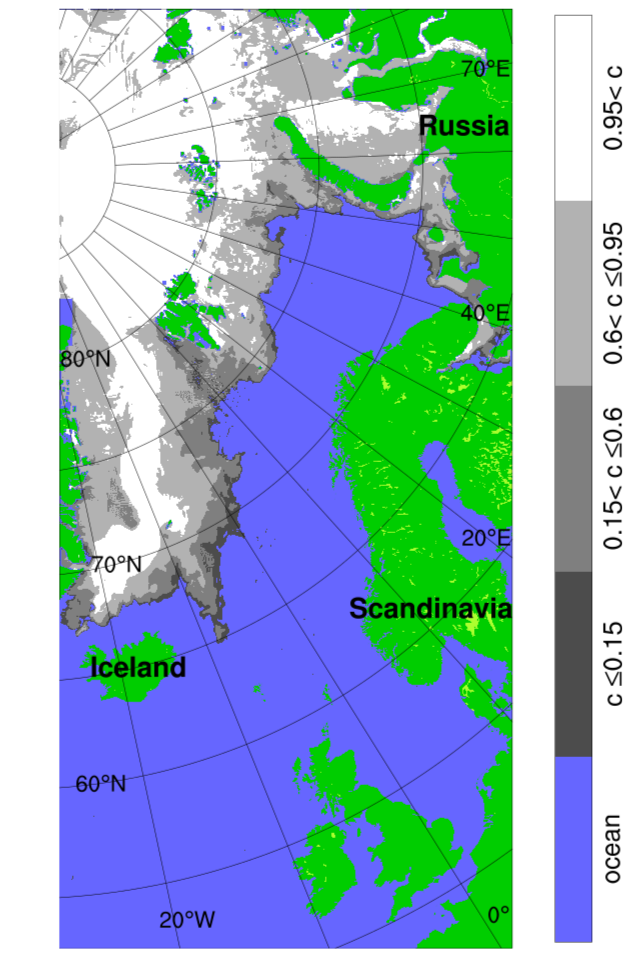
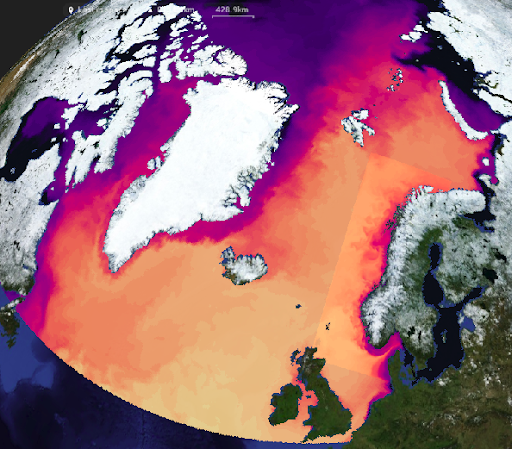
Barents-2.5 is a coupled ocean and sea ice ensemble prediction model. It is MET Norway’s main forecasting model for ocean currents and sea ice in the Barents Sea and around Svalbard. Previous analysis as well as the latest forecast are available on
THREDDS. The model is based on the METROMS (
GitHub) framework which implements the coupling between the ocean component (ROMS) and the sea ice component (CICE).
The model employs a regular grid in the horizontal with 2.5km resolution, and an irregular topography-following vertical coordinate system for the ocean consisting of 42 layers, while the ice is modeled in 5 thickness categories, each with 7 vertical layers and a single snow layer on top. The ocean and sea ice is forced by atmospheric fields from MET Norway’s 2.5km AROME-Arctic model that is setup on the same grid. Additional ensemble members use atmospheric forcing fields from ECMWF’s IFS-ENS forecasts providing perturbed atmospheric forcing. Boundary conditions come from TOPAZ, tides from TPXO tidal model, river runoff climatology from NVE data (mainland Norway) and AHYPE hydrological model (Svalbard+Russia) and the bottom topography is taken from the IBCAO v3 dataset. Daily model analysis is performed using an Ensemble Kalman Filter that assimilates sea ice concentration from passive microwave imagery (https://cryo.met.no/en/sirano), IR sea surface temperature, and in-situ hydrography. The model uncertainty is estimated from 24 ensemble members, of which 6 members are updated with new atmospheric forcing every 6 hours.
Daily updated validation results are available here:
Reference:
Röhrs, J., Gusdal, Y., Rikardsen, E. S. U., Durán Moro, M., Brændshøi, J., Kristensen, N. M., Fritzner, S., Wang, K., Sperrevik, A. K., Idžanović, M., Lavergne, T., Debernard, J. B., and Christensen, K. H, 2023. Barents-2.5km v2.0: an operational data-assimilative coupled ocean and sea ice ensemble prediction model for the Barents Sea and Svalbard. Geosci. Model Dev., 16, 5401–5426.
https://doi.org/10.5194/gmd-16-5401-2023
Duarte, P., Brændshøi, J., Shcherbin, D., Barras, P., Albretsen, J., Gusdal, Y., Szapiro, N., Martinsen, A., Samuelsen, A., Wang, K., Debernard, J.B, 2022. Implementation and evaluation of open boundary conditions for sea ice in a regional coupled ocean (ROMS) and sea ice (CICE) modeling system. Geosci. Model Dev., 15, 4373–4392.
https://doi.org/10.5194/gmd-15-4373-2022
Fritzner, S.M., Graversen, R.G., Wang, K., Christensen, K.H., 2018. Comparison between a multi-variate nudging method and the ensemble Kalman filter for sea-ice data assimilation. Journal of Glaciology 64, 387–396.
https://doi.org/10.1017/jog.2018.33
Fritzner, S.M., Graversen, R., Christensen, K.H., Rostosky, P., Wang, K., 2019. Impact of assimilating sea ice concentration, sea ice thickness and snow depth in a coupled ocean-sea ice modelling system. Ocean Sci. 13, 491–509.
https://doi.org/10.5194/tc-13-491-2019
STORMSURGE
The Stormsurge model is MET Norway’s main forecasting model for sea level and stormsurge. It is based on the ROMS model in barotropic mode (2D), covering the area from Bretagne in France, through the North Sea, around the British Isles, the Norwegian coast, the Barents Sea and parts of the eastern coast of Greenland and the Nordic Sea.
The model has a horizontal resolution of 4km and is forced by atmospheric forcing from the MEPS 2.5km atmospheric model. Five days Forecasts (120 hours) produced and updated every 6 hour. The Forecasts are postprocessed and nudged towards observations from Norwegian coastal stations.
In addition to this setup, a similar setup is run in ensemble mode (EPS). This produces a 50+1 forecast for +120h twice per day based on the full ECMWF ensemble forecast system. Results are made available through
api.met.no (https://api.met.no/weatherapi/tidalwater/1.1/documentation) and can also be viewed on
SeHavnivå.
Reference:
NORKYST
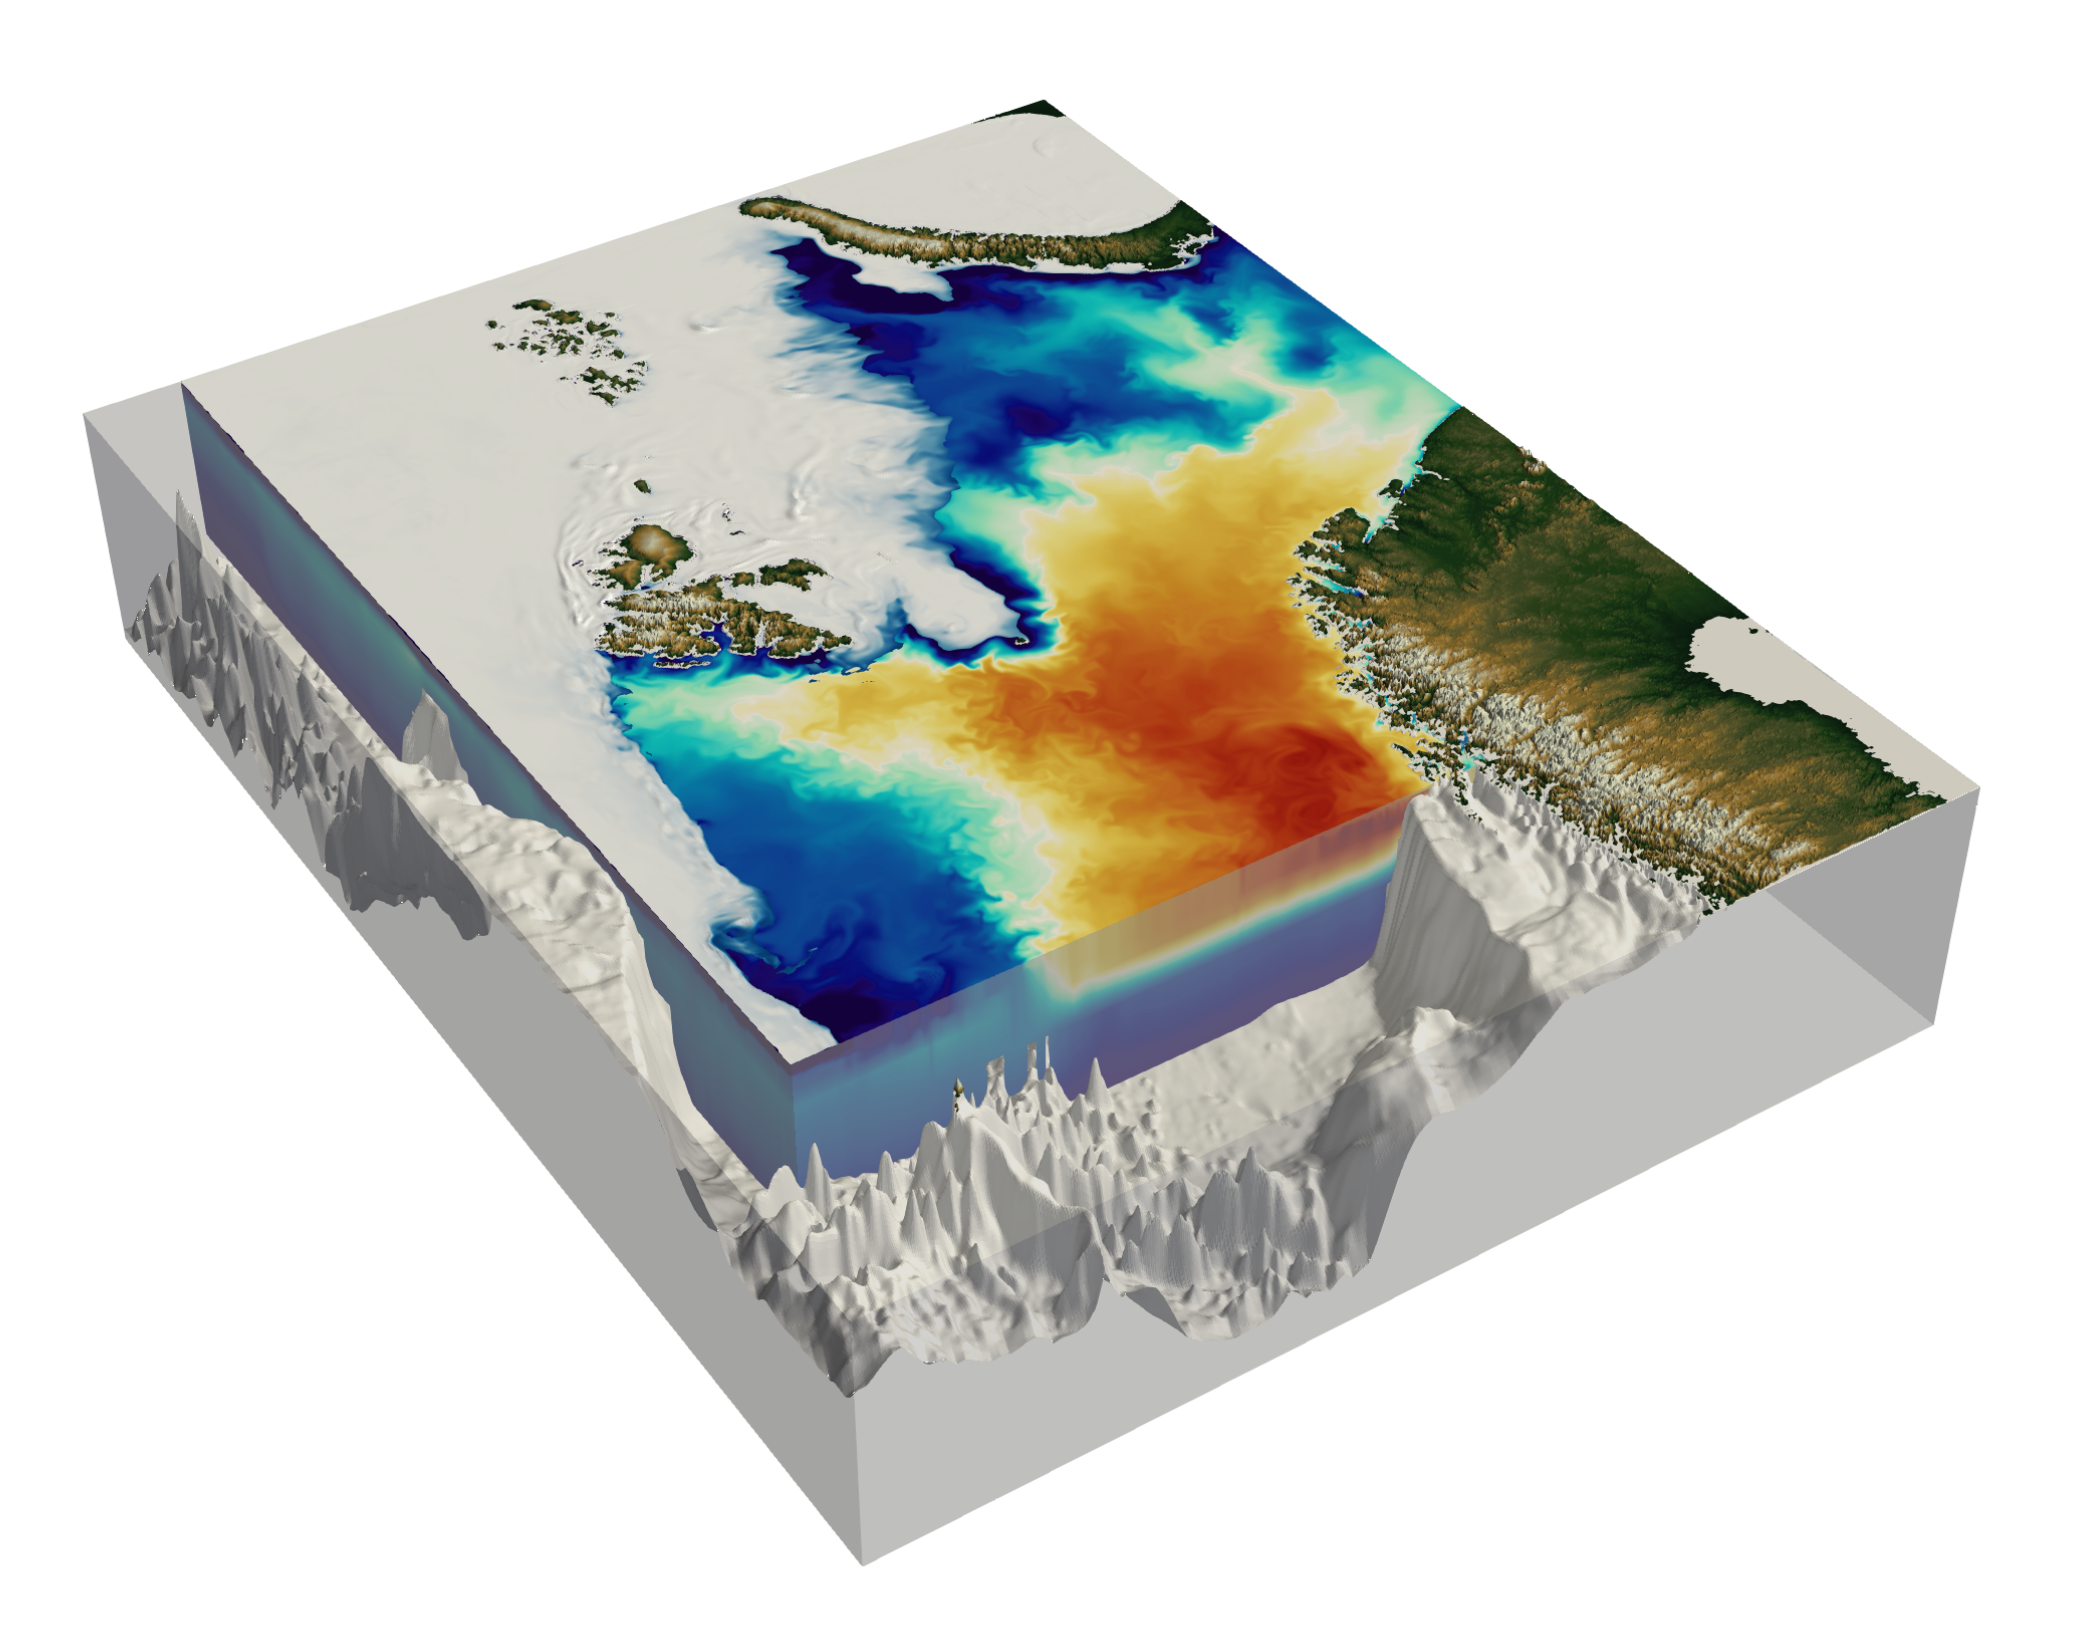
Norkyst is used as the main forecast tool for ocean forecasting at the coast of Norway. This includes forecasting of sea surface temperatures and ocean currents in oil spill preparedness modeling, Search-and-Rescue preparedness models, and plankton dispersion models. All analysis runs are available on
THREDDS. The Norkyst model is a collaboration project between the Institute of Marine Research (IMR) and the Norwegian Meteorological Institute.
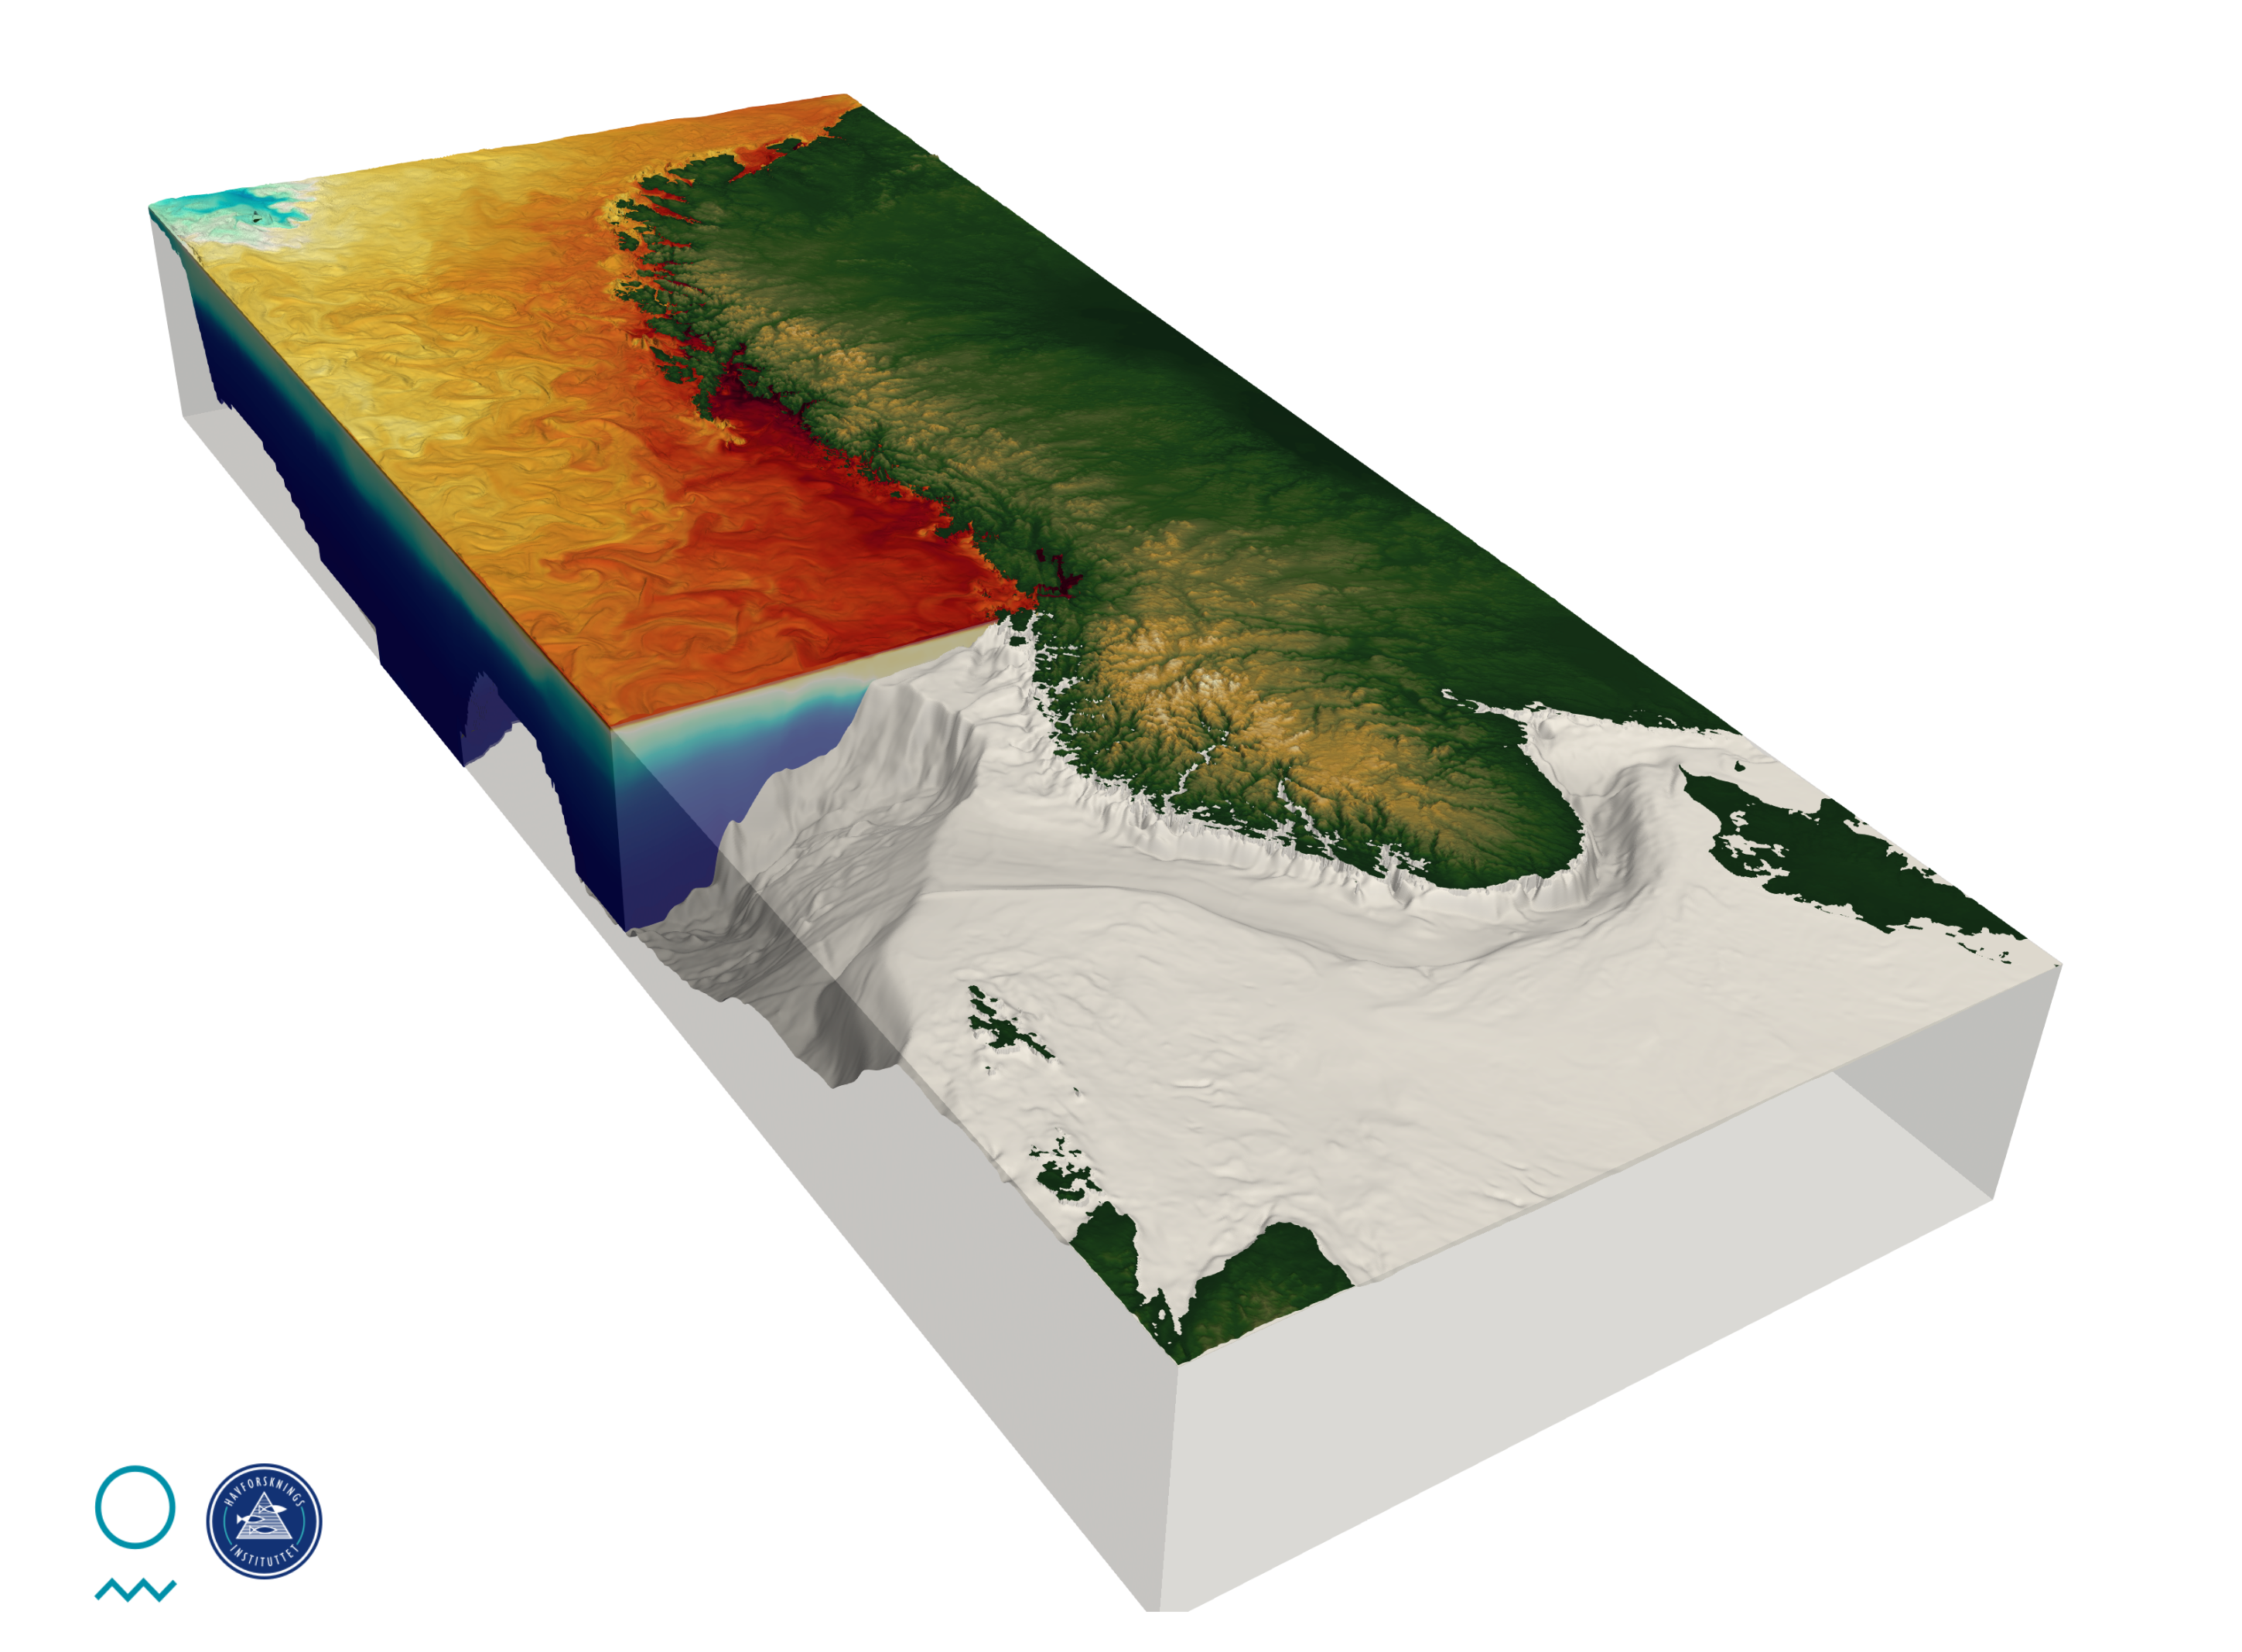
Norkyst is our coastal and shelf sea ocean circulation model. The setup is based on ROMS with a horizontal resolution of 800m and 35 vertical layers, hence permitting mesoscale eddies. The most dominant features of the coastline are resolved including all major fjords, yet not the smallest islands and bays. It receives tidal forcing from a global inverse barotropic model of ocean tides,
TPXO7.26, through prescription of amplitude and phase for sea surface elevation and currents for the major eight primary harmonic constituents (M2, S2, N2, K1, K2, O1, P1, Q1) of diurnal and semidiurnal frequencies. Atmospheric forcing is provided by surface fields from
AROME-MetCoOP. Lateral boundary conditions for Norkyst are provided by
Topaz and the
CMEMS Baltic sea model for temperature and salinity in the Kattegat area. "For the Norwegian rivers, real-time runoff data based on daily observed runoff are collected from The Norwegian Water Resources and Energy Directorate (NVE)". Norkyst calculates atmospheric fluxes through a bulk formula formulation based on atmospheric variables, and vertical turbulence is parameterized through the k-gen GLS mixing scheme.
Reference:
Albretsen, J., Sperrevik, A.K., Staalstrøm, A., Sandvik, A.D., Vikebø, F., Asplin, L., 2011. NorKyst-800 Rapport nr. 1 : Brukermanual og tekniske beskrivelser. NorKyst-800 Report No. 1 : User Manual and technical descriptions.
Röhrs, J., Christensen, K.H., Vikebø, F.B., Sundby, S., Saetra, O., Broström, G., 2014. Wave-induced transport and vertical mixing of pelagic eggs and larvae. Limnol. Oceanogr. 59(4), 1213–1227.
https://doi.org/10.4319/lo.2014.59.4.1213
Idžanović, M., Ophaug, V., Andersen, O.B., 2017. The coastal mean dynamic topography in Norway observed by CryoSat-2 and GOCE. Geophysical Research Letters 44, 5609–5617.
https://doi.org/10.1002/2017GL073777
Myksvoll, M.S., Sandvik, A.D., Albretsen, J., Asplin, L., Johnsen, I.A., Karlsen, Ø., Kristensen, N.M., Melsom, A., Skardhamar, J., Ådlandsvik, B., 2018. Evaluation of a national operational salmon lice monitoring system—From physics to fish. PLOS ONE 13, e0201338.
https://doi.org/10.1371/journal.pone.0201338
Asplin, L., Albretsen, J., Johnsen, I.A., Sandvik, A.D., 2020. The hydrodynamic foundation for salmon lice dispersion modeling along the Norwegian coast. Ocean Dynamics 70, 1151–1167.
https://doi.org/10.1007/s10236-020-01378-0
NORKYST_DA
A setup of the
Norkyst domain with reduced horizontal resolution is used for data assimilation. The Norkyst_DA setup uses a horizontal resolution of 2.4km and 42 vertical levels and is based on the Regional Ocean Modeling System (ROMS) with a physical space 4D-variational (4D-Var) DA scheme. The horizontal model resolution of 2.4km has been chosen to suit the scale of the available observations, and to compromise the need to resolve high resolution eddy dynamics while confining nonlinearities that limit the 4D-Var DA capabilities. Norkyst_DA assimilates satellite sea surface temperature, in-situ observations from ARGOS drifters, CTD sections and ferry boxes and HF-radar surface currents. Assimilation of sea level anomaly and SAR currents is currently in a development and testing stage. Norkyst_DA observation and performance tracking are presented
HERE. The data are archived on
THREDDS
Reference:
Röhrs, J., Sperrevik, A.K., Christensen, K.H., 2018. NorShelf: An ocean reanalysis and data-assimilative forecast model for the Norwegian Shelf Sea (No. ISSN 2387-4201 04/2018), MET Report. Norwegian Meteorological Institute, Oslo, Norway.
https://doi.org/10.5281/zenodo.2384124
Sperrevik, A.K., Christensen, K.H., Röhrs, J., 2015. Constraining energetic slope currents through assimilation of high-frequency radar observations. Ocean Sci 11, 237–249.
https://doi.org/10.5194/os-11-237-2015
Sperrevik, A.K., Röhrs, J., Christensen, K.H., 2017. Impact of data assimilation on Eulerian versus Lagrangian estimates of upper ocean transport. J. Geophys. Res. Oceans 122, 5445–5457.
https://doi.org/10.1002/2016JC012640
Röhrs, J., Sutherland, G., Jeans, G., Bedington, M., Sperrevik, A.K., Dagestad, K.-F., Gusdal, Y., Mauritzen, C., Dale, A., LaCasce, J.H., 2021. Surface currents in operational oceanography: Key applications, mechanisms, and methods. Journal of Operational Oceanography 0, 1–29.
https://doi.org/10.1080/1755876X.2021.1903221
TOPAZ
Along with the Nansen Environmental and Remote Sensing Center (
NERSC) and the Institute of Marine Research (Havforskningsinstituttet -
HI), the Norwegian Meteorological Institute produces forecasts which are disseminated by the pan-European
Copernicus Marine Service. The collaboration with NERSC and HI takes place in the Service' Arctic Monitoring and Forecasting Center (Arctic MFC). The
Arctic MFC nominal forecast system is the TOPAZ system based on an advanced sequential data assimilation method (the Deterministic Ensemble Kalman Filter, DEnKF; Sakov and Oke, 2009) and the Hybrid Coordinate Ocean Model (HYCOM; Chassignet et a., 2007), coupled to a sea ice model.
TOPAZ general circulation forecasts
The operational system uses the HYCOM model and a 100-member Ensemble Kalman Filter (EnKF) assimilation scheme, available from the Copernicus Marine Service's catalog as product: ARCTIC_ANALYSIS_FORECAST_002_001_a (registration required, access is free of charge). It is run daily to provide 10 days of forecast (from an average of 10 ensemble members) of the 3D physical ocean, including sea ice. In addition, the system provides a 10-day forecast of the ocean biogeochemical variables. Data assimilation is performed weekly to provide 7 days of analysis (ensemble average). Output products are interpolated on a grid of 12.5 km resolution at the North Pole (equivalent to 1/8 deg in mid-latitudes) on a polar stereographic projection. Results from weekly updated validation of forecasts are also available. Data from the following observational products are assimilated:
- Sea Ice Concentration from OSISAF passive microwave data
- Thickness of thin sea ice from SMOS
- Blended Optimum Interpolation SST data
- Temperature and salinity profiles from Argo drifters
- Sea Level from multiple altimeter missions
TOPAZ forecasts for surface currents and sea level
A higher horizontal grid resolution version of the TOPAZ system at ~3km forced with astronomical tides is run daily to provide a product consisting of 10-day forecasts of the ocean tides and surface currents for the pan-Arctic region. These forecasts are given at 15 minutes instantaneous profiles and can be accessed from the Copernicus Marine Service's catalog as product:
ARCTIC_ANALYSISFORECAST_PHY_TIDE_002_015, where documentation and information on how to download the product are given.